|
Report from
Europe
Slow start to the year for EU27 tropical wood imports
In the first quarter of this year, the EU27 imported 427,000
tonnes of tropical wood and wooden furniture products with a total value
of US$896m, respectively 12% and 22% less than the same period in 2022.
Compared to the last quarter of 2022, imports in Q1 2023 were up 1.2% in
dollar value and 3.1% in tonnage terms.
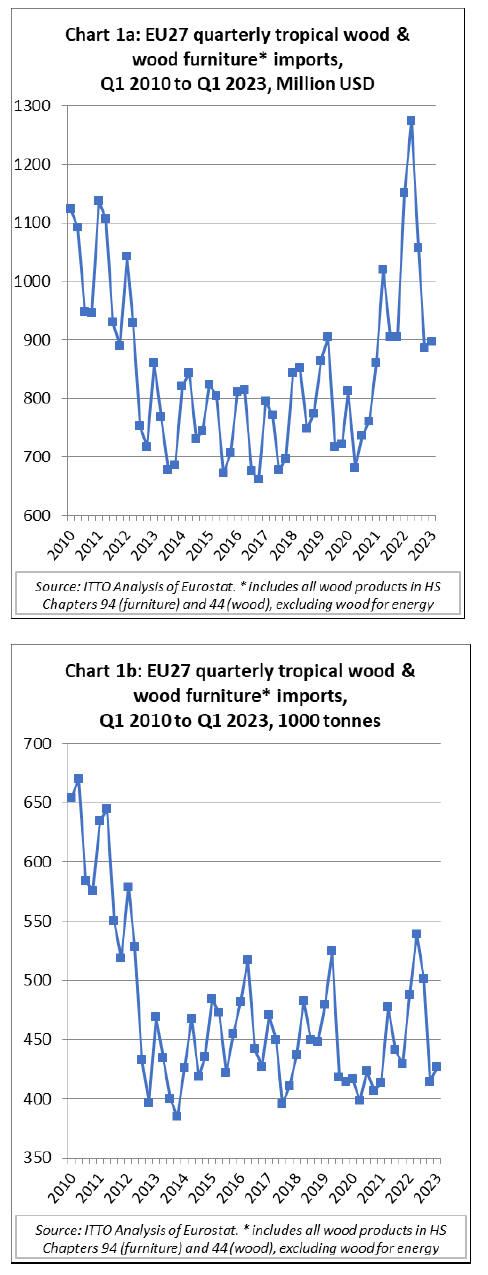
After falling sharply in the second half of 2022 from the 10-year peak
recorded in the first half of last year,, imports stabilised in the
first quarter this year.
In the first three months this year, in dollar terms, EU27 imports of
tropical wood and wooden furniture were significantly above the
long-term average of around US$800m per quarter between 2012 and 2019,
the period of relatively stagnant market conditions for tropical
products that prevailed in Europe before the COVID crises (Chart 1a).
However, in tonnage terms, EU27 imports in the first quarter this year
were below the long-term average of around 450,000 tonnes per quarter
during the 2012 to 2019 period (Chart 1b).
The weak start in the European market this year is due to a combination of
relatively high stocks and slow consumption. In 2021 and the first half
of 2022, EU importers responded to sharply rising consumption in the
European market – boosted particularly by heavy spending on home
improvement and public finance to support economic recovery after the
pandemic – by buying in larger volumes as CIF prices were rising to
record high levels.
However, demand in Europe fell dramatically during the summer months
last year with rising economic uncertainty, particularly fuelled by the
war in Ukraine and high energy costs.
At the same time, global prices for wood materials and freight rates
fell dramatically in the second half of last year. A big decline in
global trade followed on from sharply rising interest rates in the
United States and as China struggled to maintain a zero-COVID strategy
and suffered a property market slump. The price of a 40-foot container
for delivery into Europe from the Southeast Asia, which hit record
levels in excess of US$17,000 at the end of 2021, had fallen to around
US$1,500 in the first quarter of 2023.
The combined effect of these trends was that at the start of this year
many European timber importers were sitting on quite large stocks bought
earlier at high prices which they were struggling to shift on to their
customers. The value of these landed stocks was being undermined as
prices for new orders in the main supply countries were falling. Costs
of holding stock and manufacturing wood products were also rising as
interest rates were being pushed up and energy costs were soaring during
the winter months.
The problems associated with high stocks and falling prices particularly
applied to products sourced from Asia, including garden furniture,
decking, flooring, and other joinery products. In the case of African
hardwoods, although prices for existing landed stock in Europe have been
falling as large volumes arrived last year and consumption has been
slow, availability for forward orders from African sawmills in the
second half of this year is restricted and prices are firm and expected
to remain so.
This reflects rising overheads for African producers, driven by fuel and
energy inflation, which is resulting in falling output.
Decline in EU import value in nearly all countries and tropical
wood products
There was a year-on-year decline in EU27 import value for all
tropical wood product groups except sawnwood and logs between January
and March this year (Chart 2a).
During the three-month period, import value of sawnwood was up only
marginally, by 2% to US$218m, while for logs there was a much larger 41%
gain, to US$18.8m.
However, these increases were more than offset by large declines in import
value for: wooden furniture from tropical countries (-30% to US$350m);
tropical mouldings/decking (-44% to US$154m); tropical joinery products
(-33% to US$51m); tropical-hardwood faced plywood (-10% to US$50m);
tropical veneer (-19% to US$46m); tropical marquetry (-32% to US$22m);
and tropical flooring (-22% to US$16m).
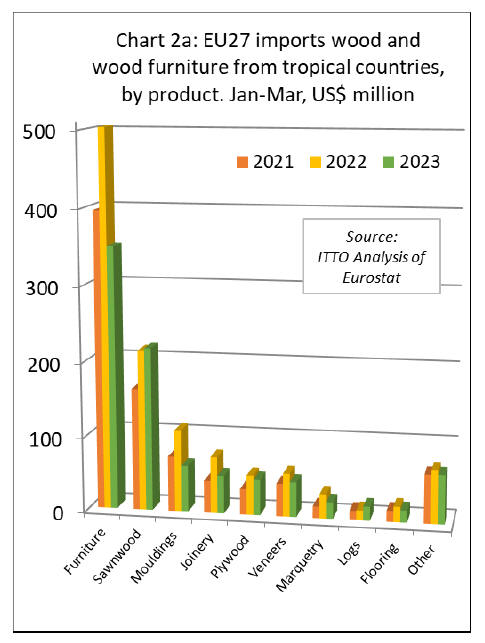
In terms of EU destinations, import value of tropical wood and wooden
furniture in the first quarter this year was down year-on-year in all
the main markets except Spain (+5% to US$59m) and Portugal (+1% to
US$13m).
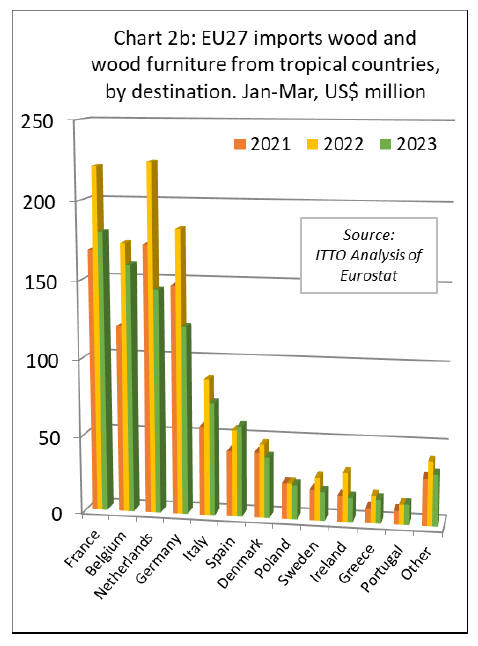
Import value fell 19% in France to US$180m, 8% in Belgium to US$160m, 36%
in the Netherlands to US$144m, 34% in Germany to US$121m, 17% in Italy
to US$73m, 17% in Denmark to US$39m, 5% to US$22 million in Poland, 33%
to US$19m in Poland, and 50% to US$16m in Ireland. (Chart 2b above).
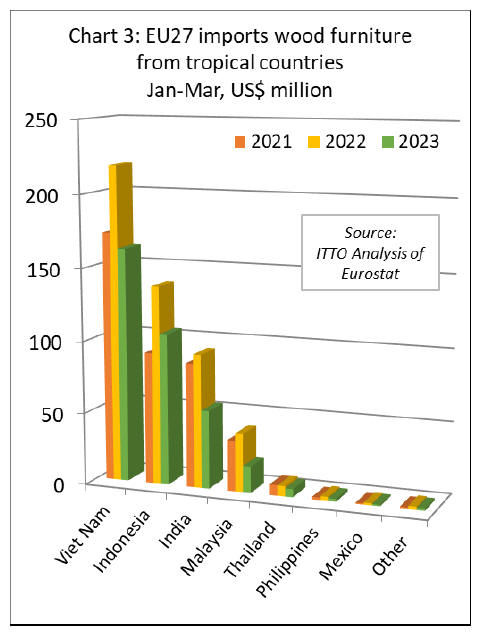
EU27 wooden furniture imports from tropical countries down 30%
in the first quarter
In the first three months of 2023, the EU27 imported 74,400
tonnes of wooden furniture from tropical countries with a total value of
US$350m, 30% less in both tonnage and value terms than the same period
in 2022.
Import value decreased 26% to US$162m from Vietnam, 24% to US$105m from
Indonesia, 41% to US$54m from India, 54% to US$18m from Malaysia, and
22% to US$6m from Thailand. EU27 wooden furniture imports from all other
tropical countries were negligible during the three-month period (Chart
3).
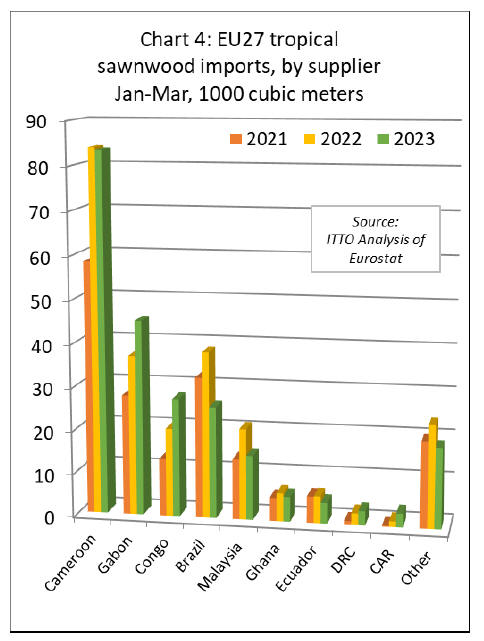
EU27 imports of tropical sawnwood still high but decking imports
down sharply
In contrast to other tropical wood products, EU27 imports of
tropical sawnwood in the first quarter of 2023 sustained the relatively
high levels recorded the previous year.
While year-on-year import volume was down 4% to 232,000 cubic metres,
import value was up 2% to US$218m. There were particularly large gains
in tropical sawnwood imports from Gabon (+22% to 45,100 cubic meters)
and Congo (+34% to 27,400 cubic metres) in the first three months this
year. Imports also increased significantly from a smaller base from DRC
(+21% to 3,300 cubic metres) and CAR (+144% to 3,200 cubic metres).
These gains offset a decline in imports from Cameroon (-1% to 83,500 cubic
meters), Brazil (-33% to 25,800 cubic metres), Malaysia (-29% to 14,900
cubic metres), Ghana (-3% to 5,800 cubic metres) and Ghana (-23% to
4,800 cubic merers) (Chart 4).
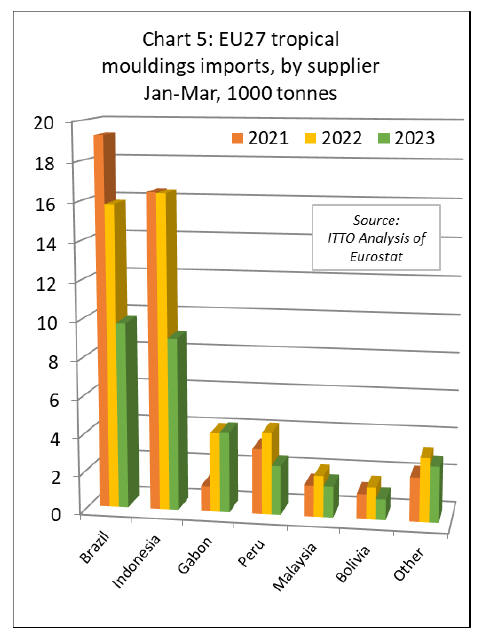
In contrast to sawnwood, EU27 imports of tropical mouldings/decking were
slow in the first three months of this year. After all the work carried
out on garden improvement during the pandemic, the European market for
tropical hardwood decking has now slowed to a crawl. European importers
are carrying heavy stocks bought at high prices last year and are not in
the market for new supplies.
EU27 imports of mouldings/decking in the first three months of 2023 were
31,100 tonnes with value of US$62m, respectively down 35% and 43%
compared to the same period last year. Imports fell sharply for the two
largest supply countries; down 38% to 9,700 tonnes from Brazil and down
45% to 9,000 tonnes from Indonesia.
There was also a sharp fall in imports from Peru (-40% to 2,600 tonnes),
Malaysia (-24% to 1,600 tonnes), and Bolivia (-35% to 1,000 tonnes).
Imports from Gabon increased, but only by 1% to 4,200 tonnes (Chart 5).
In the first three months of 2023, the EU27 imported 29,800 cubic metres
of tropical logs, 21% more than the same period in 2022. The most
significant trend was a sharp 195% rise in EU27 log imports from Congo
to 17,600 cubic metres in the first quarter this year. This surge in
European arrivals probably reflects a last-minute effort to ship logs in
advance of the log export ban imposed by the Republic of Congo from 1st
January 2023.
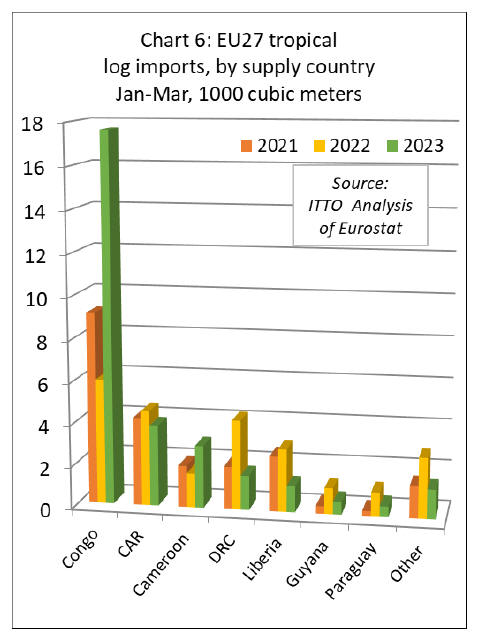
EU27 imports of logs also increased sharply from Cameroon (which may be
derived from neighbouring Congo or Central African Republic) in the
first quarter this year, rising 83% year-on-year to 3,000 cubic metres.
EU27 imports of tropical logs from all other supply countries declined
during the period including Central African Republic (-15% to 3,850
cubic metres), Democratic Republic of Congo (-62% to 1,650 cubic metres),
Liberia (-58% to 1,250 cubic metres), Guyana (-52% to 600 cubic metres)
and Paraguay (-56% to 500 cubic metres) (Chart 6).
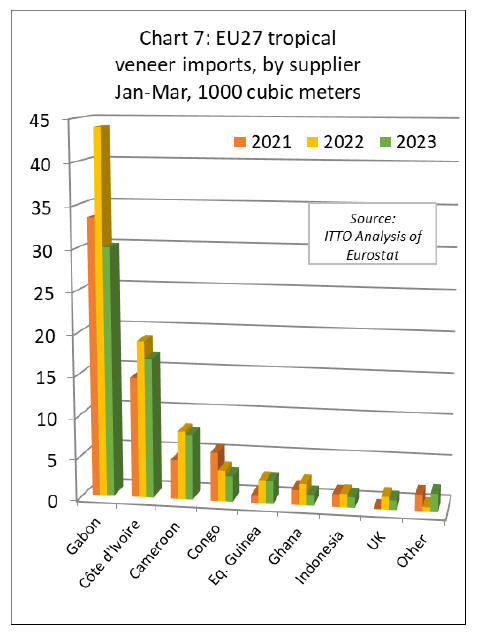
Downturn in EU27 imports of tropical veneer but plywood more
stable
In the first three months of 2023, the EU27 imported 66,500
cubic metres of tropical veneer with a value of US$46m, respectively
down 21% and 19% compared to the same period last year.
Imports of tropical veneer from Gabon, by far the largest supplier to
the EU27, decreased 32% to 30,000 cubic metres after rising sharply last
year. EU27 veneer imports in the first three months of this year also
declined from Côte d'Ivoire (-11% to 16,900 cubic metres), Cameroon (-4%
to 7,900 cubic metres), Congo (-18% to 3,100 cubic metres), Equatorial
Guinea (-2% to 2,700 cubic metres), Ghana (-50% to 1,300 cubic metres),
and Indonesia (-22% to 1,300 cubic metres) (Chart 7).
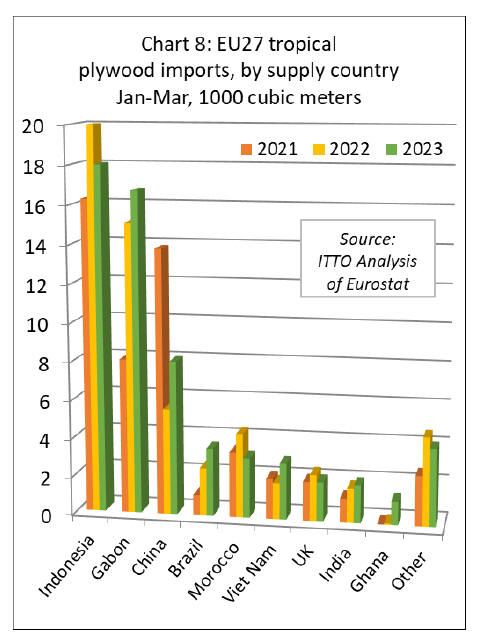
In the first three months of 2023, EU27 tropical plywood import increased
6% in volume terms to 61,700 cubic metres but declined 10% in value
terms to US$48m.
The average per cubic meter value of tropical plywood imported into the
EU in the first quarter this year was US$775 compared to US$907 in the
same period last year, a sign both of the sharp fall in prices and
freight rates and the shift in product sources this year.
Imports from Indonesia, at 18,000 cubic metres, were down 10% compared
to the same period last year. Imports also fell from Morocco, by 29% to
3,100 cubic metres.
However, imports increased from Gabon (+11% to 16,700 cubic metres),
China (+45% to 8,000 cubic metres), Brazil (+42% to 3,600 cubic metres),
Vietnam (+55% to 3,000 cubic metres), and India (+11% to 2,000 cubic
metres). For the first time in many years, there was also a significant
rise in plywood imports into the EU from Ghana in the first quarter this
year, up from negligible levels to 1,200 cubic metres (Chart 8).
Slowdown in EU27 imports of joinery products from tropical
countries in first quarter
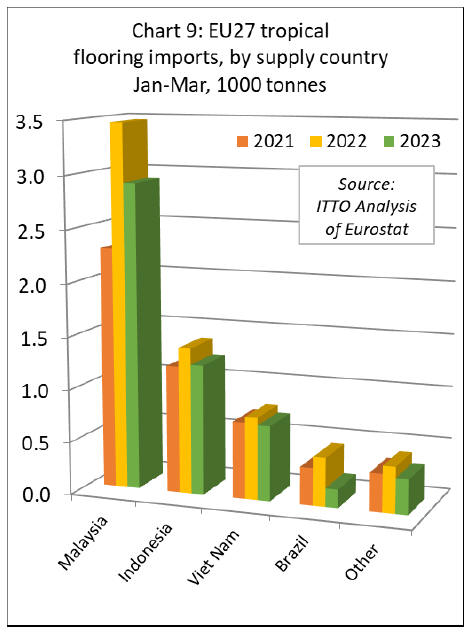
In the first three months of 2023, the EU27 imported 5,400
tonnes of tropical wood flooring with a value of US$16m, respectively
down 18% and 22% compared to the same period last year.
The consistent rise in EU27 wood flooring imports from Malaysia that
began in 2020, stalled in the first quarter this year. Imports of 2,900
tonnes from Malaysia in the first three months of 2023 were 16% less
than the same period in 2022. Imports also fell from Indonesia (-11% to
1,200 tonnes), Vietnam (-9% to 700 tonnes), and Brazil (-62% to 200
tonnes) (Chart 9).
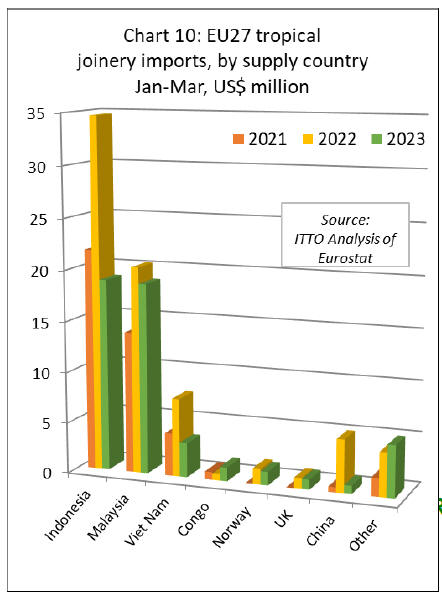
The value of EU27 imports of other joinery products from tropical
countries - which mainly comprise laminated window scantlings, kitchen
tops and wood doors – declined 33% to US$51m in the first three months
of 2023. Despite much lower prices than the same time last year, imports
are low this year as many importers already have sufficient stock to
meet current slow consumption levels.
In the first quarter this year compared to the same period in 2022,
imports were down 10% to US$19m million from Indonesia, down 8% to
US$19m from Malaysia, down 56% to US$3m from Vietnam, and down 84% to
less than US$1m from China. In a potentially significant longer-term
development, given efforts in the country to shift up the value chain as
log exports are banned, EU imports of laminated joinery products from
Congo were valued at US$1.4m in the first quarter of this year, more
than double than during the same period last year (Chart 10).
|