|
Report from
North America
Sawnwood imports rebound
US sawn hardwood imports rebounded in March following
a 24% drop in February. March imports of sawn hardwood
were 75,114 cu.m., up 41% from the previous month. The
volume share of tropical sawnwood in total hardwood
imports declined in March compared previous months, but
tropical species accounted for over half of the value of
imports.
Tropical sawnwood imports increased 24% in March to
19,978 cu.m. and year-to-date imports were also up from
the same time in 2016.The value of imports grew 36%
from February. Ipe sawnwood imports were 2,780 cu.m. in
March, up 14% year-to-date from March 2016.
Ipe imports from Brazil were valued US$5.8 million, in
addition to small import volumes from Guyana and Spain.
Balsa sawnwood imports from Ecuador recovered in
March. Balsa imports were 7,352 cu.m., a 76% increase in
year-to-date imports compared to the same time last year.
Imports of sapelli sawnwood were down from February,
but year-to-date imports increased 11% from March 2016.
Cameroon exported 922 cu.m. of sapelli sawnwood to the
US in March, followed by Congo/Brazzaville with 604
cu.m.
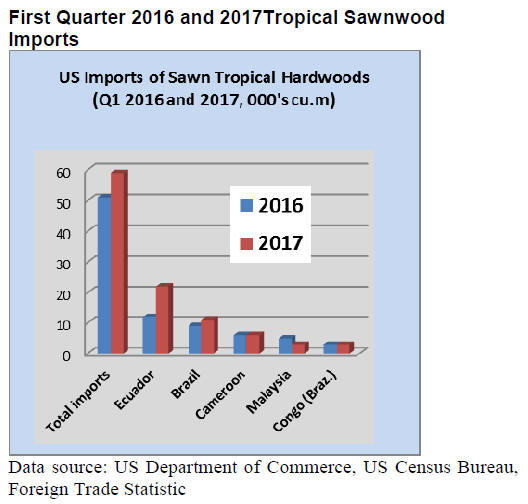
Hardwood imports from Malaysia were down compared to
the same time last year due low imports in January, but in
March imports grew to 1,631 cu.m. Keruing sawnwood
accounted for the majority of Malaysian shipments in
March (1,218 cu.m.).
Imports from Indonesia were 1,145 cu.m. in March and
year-to-date imports grew 21% from the same time in
2016.
Canada doubled mahogany imports in March
Canadian imports of tropical sawnwood increased slightly
in March to US$1.95 million (all import values in US
dollars). The value of year-to-date imports was up 6%
from March 2016. Imports of mahogany sawnwood
doubled in March to US$138,948.
Compared to March 2016 year-to-date imports of
mahogany quadrupled. The growth was in mahogany
imports from Bolivia which shipped US$77,167 worth of
sawnwood, according to Statistics Canada.
Cameroon also expanded mahogany exports to Canada in
March, while sapelli imports from Cameroon declined to
US$188,431. CanadaˇŻs overall sapelli imports fell to
US$294,636 in March, down one third year-to-date
compared to March 2016.
Sawnwood imports from Brazil more than doubled in
March to US$414,194. The bulk of the imports from
Brazil are classified ˇ°nesˇ± (not elsewhere specified).
Balsa imports from Ecuador were up in March
(US$419,422). Canadian hardwood imports from
Myanmar and Peru rose in March, while imports from
Gabon, Malaysia and Thailand declined.
Malaysia and Ecuador expand share in hardwood
plywood imports
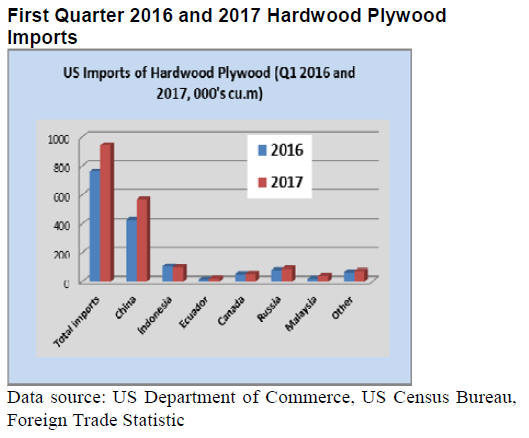
Hardwood plywood imports declined in March to 285,656
cu.m., but year-to-date imports were 25% above March
2016 levels. The value of plywood imports increased 19%
year-to-date. Plywood imports from most countries went
up in the first quarter 2017 with the exception of
Indonesia.
Imports from Malaysia and Ecuador had higher than
average growth. China expanded its share in total year-todate
plywood imports to just over 60%.
Among the smaller suppliers, Cambodia increased
plywood exports to the US in March (5,335 cu.m.).
Imports from Vietnam also grew in March (3,065 cu.m.),
but their value declined from the previous month.
Tropical veneer imports continue to fall
Tropical hardwood veneer imports grew 30% in March to
US$2.0 million, but year-to-date veneer imports remain
small compared to last year. Year-to-date the US has
imported US$6.2 million worth of tropical veneer,
compared to US$209 million at the same time last year.
Little change in moulding imports in March
Hardwood moulding imports were almost unchanged in
March at US$14.2 million. Year-to-date imports were 3%
down from March 2016. Moulding imports from Brazil
recovered in March (US$2.8 million), but year-to-date
Brazil shipped 17% less than in March last year.
China remains the largest supplier of hardwood moulding
to the US despite a one-third decline in March to US$4.4
million.
Indonesia and Vietnam expand assembled flooring
exports to US
Hardwood flooring imports fell 38% in March from the
previous month to US$2.7 million. Year-to-date imports
remain significantly up from last year. Indonesia and
China had the strongest year-to-date gain along with
smaller suppliers like Brazil. Hardwood flooring imports
from Brazil increased to US$238,520 cu.m. in March.
Malaysian shipments to the US fell by more than half
compared to March 2016.
Imports of assembled flooring panels (including
engineered hardwood flooring) increased 11% in March to
US$10.3 million. Year-to-date imports of assembled
flooring were up from March last year with most gains in
imports from Indonesia and Vietnam.
Assembled flooring imports from Vietnam were worth
US$1.1 million in March, compared to US$1.2 million
from Indonesia and US$2.5 million from China.
Wooden furniture imports from China down
The value of US wooden furniture imports declined for the
second consecutive month in March to US$1.24 billion.
Year-to-date imports were still 7% higher than in March
2016.
As in February, the month-on-month decline was mainly
in imports from China (-17%) and Vietnam (-15%). Yearto-
date imports from Vietnam however, were 15% higher
than in March last year.
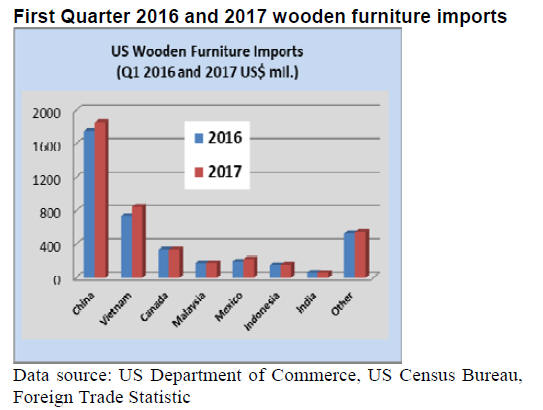
Wooden furniture imports from most other countries
increased in March. Imports from Mexico grew 16% to
79.4 billion. Furniture imports from Indonesia were
US$60.7 million, up 29% from February. Much of the
March decline in wooden furniture imports was in kitchen
furniture. Imports of most other types of wooden furniture
changed little from February.
GDP growth slows in US but consumer confidence
high
GDP growth slowed to 0.7% in the first quarter of 2017,
according to the advance estimate by the US Department
of Commerce. Lower spending by governments at all
levels and higher imports contributed to the lower growth
in GDP compared to the 2.1% growth rate in the previous
quarter.
However, investment in non-residential and residential
construction was up in the first quarter. Economic activity
in the manufacturing sector expanded in April, according
to the latest survey by the Institute for Supply
Management. Furniture manufacturing reported higher
output in April, while activity in the wood products
industry was unchanged from the previous month.
Consumer confidence in the economy has remained strong
since the election of President Trump, according to the
University of MichiganˇŻs survey of consumers. Even
before the election consumer sentiment was positive as
household incomes grew and inflation remained low.
Buying plans for household durables such as furniture
increased in May to its highest in a decade. Overall
personal consumption expenditures are expected to grow
2.3% in 2017.
|