US Dollar Exchange Rates of 25th
April 2017
China Yuan 6.8882
Report from China
Supply and consumption of wood products 2015
According to the 2016 China Forestry Development
Report, total timber supply (domestic resources and
imports) in 2015 rose 2.3% to 552 million cubic metres
(RWE).
Of the domestic timber supply, 13% was for commercial
processing, 7% farm use and fuelwood, and 27% for
fibreboard and particleboard. Timber imports accounted
for a further 53% of the total timber supply which include
logs, sawnwood, veneer, wood-based panel, wooden
furniture, wood pulp, wood chips, paper and paper
products, waste paper, as well as other wood products. The
Forestry Development Report also says China¡¯s timber
consumption rose.
Domestic timber resources are mainly consumed in
construction 30%, 1.7% in the coal industry, 29% in paper
making, 12% in wooden furniture, 3.5% in the transport
sector and 5.5% timber consumption for farmer use and
fuelwood with the balance being for other purposes.
Timber exports account for around 18% of timber supply
and comprised mainly wooden furniture, wood-based
panels, wooden doors, window and flooring, paper and
paper products.
Forest products trade of growing importantance
According to statistics from China Customs, the value of
the country¡¯s commodity trade in 2016 fell 0.9% to
US$3.685 trillion. Of the total, the value of exports
dropped 2% to US$2.097 trillion while the value of
commodity imports rose 0.6% to US$1.587 trillion.
The proportion of forest products trade to the total
commodity trade in 2016 was 3.86%, a year on year
increase of 0.22%. The proportion of forest products
exports to the total commodity exports came to 3.72%, a
year on year increase of 0.27%.
The proportion of forest products imports to total
commodity imports amounted to 4.04%, a year on year
increase of 0.15% percentage points.
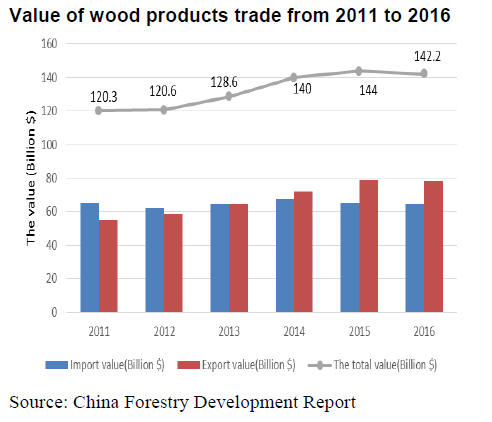
Value of wood products trade
The total value of China¡¯s wood products trade in 2016
fell 1.28% to US$142.2 billion. Of the total, the value of
forest products exports dropped 0.72% to US$78.12
billion, the value of forest products imports declined
1.95% to US$64.09 billion.
Softwood log imports volumes
The main imported softwood log species in 2016 were
radiata pine (14.09 million cu.m, 41%), spruce and fir
(5.55 million cu.m, 16%), Korean pine and Scots pine
(4.64 million cu.m, 14%), larch (2.41 million cu.m, 7%)
and Douglas fir (1.87 million cu.m, 6%).
The volume of Douglas fir, spruce and fir, radiata pine,
Korean pine and Scots pine imports rose 17%, 16%, 15%,
and 3%, but larch imports fell 5% year on year. The
above-mentioned species accounted for 84% of total
softwood log imports.
Main hardwood log imports
The main imported hardwood log species in 2016 were
okoume (852,000 cu.m, 5.79%), oak (849,000 cu.m,
5.77%), redwood (800,000 cu.m, 5.4%), beech (600 000
cu.m, 4%), North America hardwood (430,000 cu.m, 3%)
and Merbau (250,000 cu.m, 2%).
The volumes of North America hardwoods, merbau,
okoume and redwood rose 38%, 36%, 33%, and 7%
respectively, but beech and oak imports fell 16% and 5%
year on year respectively.
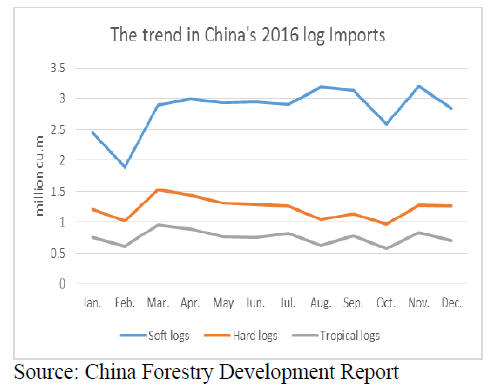
Monthly change in China¡¯s log imports
China¡¯s timber importers reduced log inventories around
the 2016 Chinese New Year celebrations in February and
at the time of the National Day Holiday in October 2016.
As will be seen in the graphic below there was a fall in log
deliveries in February and October.
The average monthly volume of softwood log imports in
2016 rose 13% to 283 million per cubic metres.
The average monthly volume of hardwood log imports
rose 2% to 123 million cubic metres per cubic metres.
Softwood log imports were largest at 3.2 million cu.m in
November and lowest in February at 1.9 million cu.m. A
similar trend can be seen between hard log imports and
tropical log imports.
Hardwood log imports and tropical log imports were
largest at 1.53 million cu.m and 0.96 million cu.m
respectively in March and lowest at 970, 000 cu.m and
580, 000 cu.m respectively in October 2016.
¡¡
|