|
Report from
Europe
Furniture production growing primarily in Asia
World production of furniture has grown constantly over
the last five years. The CSIL Word Furniture Outlook
currently estimates its worth at about US$480 billion, up
from US$437 billion in 2013. Production in Europe and
North America stagnated between 2009 and 2014.
High-income countries accounted for 39% of production
in 2014 and middle and low-income countries for 61%.
The share of middle and low-income countries in world
production first exceeded 50% in 2010 and has risen
steadily since.
A closer look at the different regions reveals variations
among the low and middle-income countries. CSIL
observed that production in South America, the Middle
East and Africa was static between 2009 and 2014. The
only region to show growth in the reporting period was
Asia and Pacific. Production there almost doubled over the
last five years.
According to CSIL, the world‟s five largest furniture
producing countries in 2014 were China, the USA,
Germany, Italy, and India. Production in China more than
doubled between 2009 and 2014. Over half of world
furniture production was in China last year. Meanwhile,
production in the US and India is increasing slowly while
production is stagnant in Germany and gradually declining
in Italy.
World furniture trade has also grown steadily since the
low of US$94 billion in 2009 during the financial crises.
CSIL estimates that the trade volume reached US$134
billion in 2014, an 8% increase compared to US$124
billion in 2013.
CSIL expects further growth to US$141 billion in 2015.
This estimate is based on assumed world GDP growth of
3.5% in 2015, with forecast growth of 2.4% in advanced
economies and 4.3% in emerging and developing
economies.
Only half of world furniture trade takes place between
countries in geographically distant regions, according to a
study published by the EU Commission at the end of 2014.
The most important of these flows are from the middle and
low-income countries of Asia to the United States and
Europe. In the European Union plus Norway, Switzerland
and Iceland about 75% of foreign furniture trade takes
place among the same countries. In the NAFTA area
(USA, Canada and Mexico), about 28% of foreign
furniture trade is among the three countries. In the Asia
and Pacific region about 38% of total foreign furniture
trade is within the region.
Upward trend in EU furniture production continues
Eurostat data shows that furniture production in the EU is
slowly recovering from the period of weakness in 2012
and 2013. The production volume index was around 1.6%
above the 2010 reference level in the first quarter of 2015,
the first time it has exceeded this level since early 2012
(Chart 1).
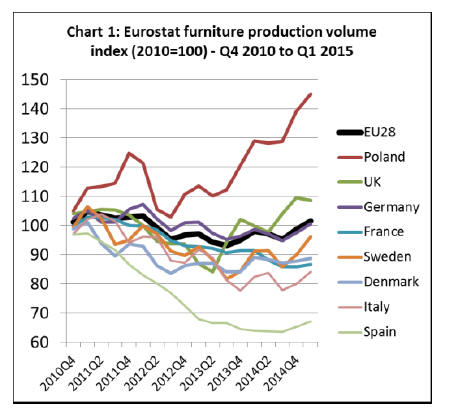
Europe‟s three largest furniture producing countries 每
Italy, Germany, and Poland - all raised their output in
2014 and early 2015. Furniture production in Poland
increased particularly sharply last year and in the first
quarter of 2015.
In the first quarter of 2015, Polish production was 45%
higher than the 2010 reference level. The furniture edition
of the German trade newsletter EUWID reports that Polish
producers exported 78% of their output in 2014. And
around 80% of the exports went to other EU countries,
with Germany being the most important recipient,
followed by France, the Czech Republic, Belgium and the
UK.
The trend in German furniture production has been very
much in line with the overall EU trend over the last four
years. German production has been rising slowly since the
end of 2013. The German furniture industry remains
under pressure from cheaper products, especially from
Poland and China, both on the domestic market and
abroad.
However, to some extent German furniture producers are
benefiting from robust domestic construction sector and
relatively strong German consumer confidence as well as
recovery in several European export markets.
The kitchen furniture industry, for example, has seen a
positive trend in 2014 and early 2015, both on the
domestic and in various European markets. According to
the German furniture industry federation VDM, there is an
on-going trend towards higher-quality and priced kitchen
furniture in Germany.
Moreover, the export markets in the Benelux region, in
particular, rebounded last year. The positive trend for
German kitchen furniture producers has continued in the
first two months of 2015, according to EUWID, with an
increase in turnover of around 1.3%. Turnover in the
German upholstery furniture sector was stable in the first
two months of this year.
Italian furniture production dipped in mid-2014 but picked
up speed again in the last quarter of 2014 and first quarter
of 2015. EUWID reports that Italian furniture producers
booked good increases in export sales towards the end of
2014, especially in non-European countries such as the
USA, China, Saudi Arabia and the United Arab Emirates.
﹛
On the domestic market Italian furniture producers
profited from tax advantages for building renovations,
which include an extra bonus for furniture, according to
FederlegnoArredo.
EU wood furniture trade analysis
The remainder of this report contains a review of the most
recently available EU wood furniture trade data to end
March 2015. Seasonal fluctuations are a major feature of
the EU furniture trade. EU wood furniture exports are
almost exclusively interior products, mainly destined for
other western countries, which tend to rise sharply at the
end of the year in the run-up to the Christmas holiday
season.
In contrast, EU imports of wood furniture tend to be
higher in the opening months of the year. This is partly
because they contain a high proportion of exterior
products mainly imported from Asian countries in the
spring months. In addition, a relatively large proportion of
the Asian furniture imported into the EU is bought during
the January sales season.
Against this background, the following analysis of EU
furniture trade uses ※12 month rolling average§ data. This
is calculated for every month by averaging the monthly
imports or exports for the previous twelve months.
The data irons out seasonal variations so that potentially
significant long-term changes can be more easily
identified.
Fall in EU wood furniture trade surplus
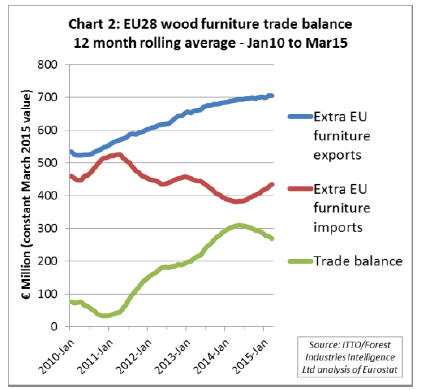
Chart 2 illustrates the trend in EU trade balance of wood
furniture using 12 month rolling average data between
January 2010 and March 2015. It shows a steady rise in
EU wood furniture exports over the last four years,
although the rate of growth has flattened somewhat in
recent months.
On the other hand, EU wood furniture imports, which had
declined since 2011 每 except for a brief interruption in
2012 每 have rebounded in late 2014 and throughout the
first quarter of 2015.
This is partly due to an increase in wood furniture
deliveries from China, which had plummeted in 2013 and
recovered again in recent months. Vietnam has also
delivered more wood furniture to Europe again in the first
months of 2015.
The shift in trade balance is partly due to improved
consumption in individual EU markets, especially in
Germany and the UK, where the construction sector has
been comparatively strong in 2014 and early 2015.
Impact of EUTR
The recent downturn and subsequent recovery in deliveries
from China and Vietnam may be partly attributable to the
EU Timber Regulation (EUTR). The sharp fall occurred at
around the time the EUTR came into force in March 2013
and may have been partly due to concerns about the
reliability of evidence provided by Chinese and
Vietnamese suppliers to demonstrate negligible risk of
illegal timber origin.
Now the EUTR has been in effect for two years, more
buyers may have established reliable supply chains and
documentation and feel more confident about importing
wood furniture from outside the EU.There is some
evidence for the impact of EUTR from interviews with
large European retailers.
A recent trade article based on interviews with
representatives of European furniture manufacturer and
retailer IKEA, flooring manufacturer Kahrs, and DIY
retailer B&Q observes:
※EUTR did not require major revision of their anti-illegal
timber strategies. Illegality risk assessment and due
diligence were already integrated into their operations,
and they are also all working towards 100% certified
sustainable sourcing. What the EUTR did do, however,
was prompt renewed scrutiny and reappraisal of existing
systems and a step up in communication on illegality
risk§.
The interviewees noted that EUTR prompted an extensive
effort to tighten and extend existing procedures, gather
additional data from suppliers and to train staff but did not
generally lead to any significant change in the supply base.
The interviewees said that they had to temporarily stop
sourcing from some companies when documentation was
inadequate. However problems were almost always
resolved so that trading could resume.
Another line of evidence for the impact of EUTR is
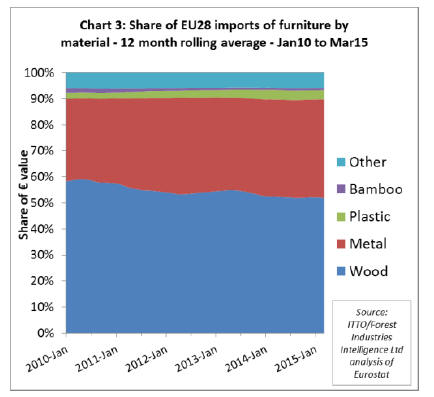
provided by analysis of the share wood in total furniture
imports (Chart 3). Wood‟s share of total furniture import
value fell in the second half of 2013 when EUTR was first
implemented, from around 55% to 53%.
This loss of share was at the expense of metals and, to a
lesser extent, plastic. However, wood‟s share of import
value stabilised in 2014 and 2015. In the 12 months to
March 2015, wood still accounted for 53% of furniture
import value, compared to 38% for metals, 3.5% for
plastic, 1% for bamboo and 5.5% for other materials.
Euro-dollar exchange rate influencing trade balance
An important factor in the recent euro-based increase in
EU wood furniture imports is the dramatic loss in value of
the euro against the US dollar over the last twelve months.
This has led to exchange-rate related price inflation.
The euro lost around 16% of value against the US dollar
between June 2014 and June 2015. Early this year the euro
hit a historic low, triggered by the renewed financial
troubles in Greece and the Swiss government decoupling
the franc from the euro in December 2014.
Turnaround in imports from Asia
Chart 4, which shows the trend in EU imports of wood
furniture by supply country using 12 month rolling
average data, reveals that the lasting downhill trend in
imports has turned around at the end of 2014.
This positive trend continued through the first quarter of
2015. In the first quarter of this year, Chinese wood
furniture deliveries to the EU rose by 12.4% and China
alone accounted for 55% of total imports. In the first
quarter of last year, China‟s share stood at 54%.
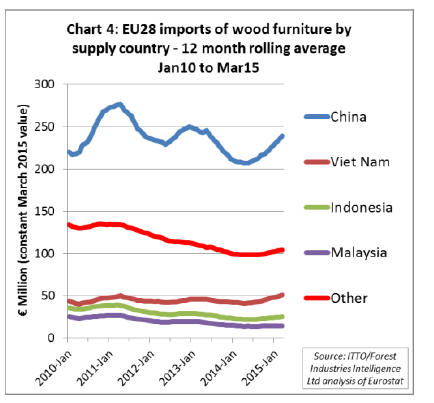
Vietnam and Indonesia also regained some of the ground
lost between 2011 and 2014, while deliveries from
Malaysia were stagnating. Vietnam‟s share in total imports
rose from 11% to 12 % between the first quarter of 2014
and the first quarter of this year. Indonesia‟s share was
stable at 6% while Malaysia‟s slipped from 4% to 3%.
Chart 5 shows the trend in all imports of wood furniture
(from both within and outside the EU) by EU member
state using 12 month rolling average data. It indicates that
the overall downhill trend that persisted during most of the
period from 2011 to 2014 has turned around in various
member states.
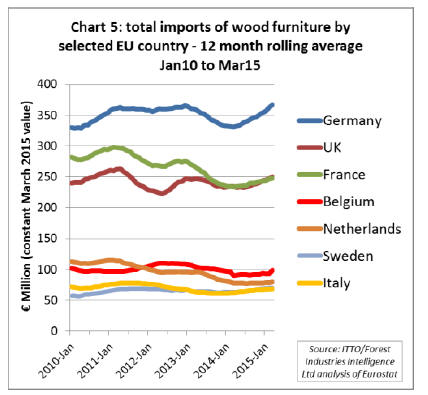
The important German market went through a period of
weakness from the end of 2012 to the beginning of 2014.
However, German wood furniture imports have picked up
significantly in recent months and early 2015 volumes
exceed the previous peak in early 2012.
UK furniture imports have been relatively stable overall in
the last four years and were showing signs of
strengthening in the first quarter of 2015. Imports into
France, much affected by the financial crisis in recent
years, are also showing signs of recovery.
Among the smaller importing countries, the slow but
steady stabilisation in Italy has continued through the first
few months of 2015 and Sweden and Belgium are also
recovering slowly. However imports into the Netherlands
remain at a very low level.
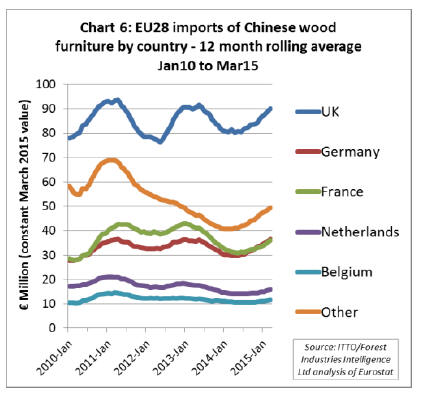
Analysis of EU member states‟ imports of Chinese wood
furniture reveals strong recovery across a wide range of
markets since mid-2014 (Chart 6).
Lower EU furniture exports to CIS region
Chart 7 shows the trend between January 2010 and March
2015 in EU exports of wood furniture to non-EU countries
by destination region using 12 month rolling average data.
This reveals that the slow-down noted in growth of EU
exports to Russia and Eastern Europe from the second half
of 2013 has since turned into decline.
This reflects political tensions between the EU and Russia
in connection with the crisis in the Ukraine as well as
economic difficulties in Russia, which have been
aggravated by the political crisis.
According to an article in the German magazine Spiegel,
the World Bank expects Russian GDP to shrink by 2.7%
this year. This in turn is expected to have a significant
impact on Russian imports of consumer products from the
EU and Switzerland during the rest of 2015.
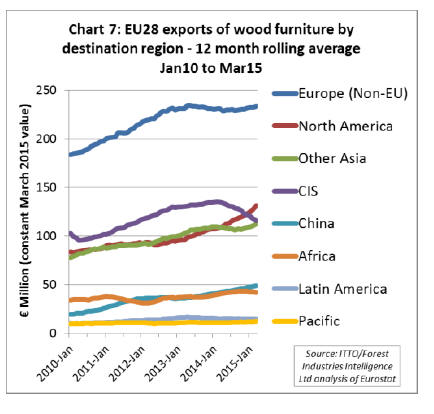
EU wood furniture exports to European countries outside
the EU were stable over the last twelve months. The same
is true for deliveries to Latin America, the Pacific region
and Africa. On the other hand, exports to North America
continued to rise sharply and deliveries to China and other
Asian countries are also increasing.
Poland closing gap on Italy the EU*s top wooden
furniture exporter
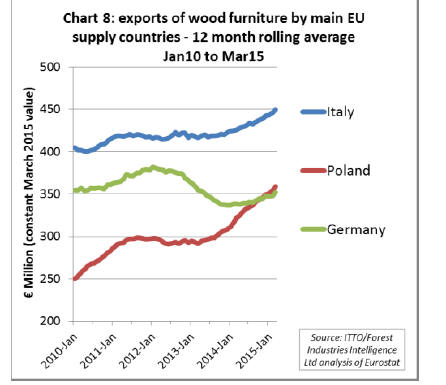
Chart 8 shows the trend in exports of wood furniture (both
within and outside the EU) by the EU‟s three largest
furniture producing countries in the period to end March
2015. Exports from Poland and Italy have performed more
strongly than those from Germany in recent years.
Italy is still by far the largest European exporter of wood
furniture but Poland has been closing the gap in the last
two years. In late 2014 Poland overtook Germany to
become Europe‟s second largest exporter of wood
furniture. However German exports have been rising since
the start of 2014 after a sharp downturn in 2012 and 2013.
Besides competitive pressure, the comparatively weak
performance of German exporters over the last few years
could also be due to the relatively strong domestic market
in Germany. Against this background, German producers
were under less pressure than Italian furniture
manufacturers, for example, to find new export
opportunities.
Exports by other EU wood furniture exporting countries
showed mixed trends (Chart 9). The sharp downward turn
in French exports registered since 2010 levelled off in
2014 and exports have since stabilised at a relatively low
level. Exports from Denmark show a slow but steady
upturn since 2013 and the country is now the fourth largest
exporter of wood furniture in the EU.
Sweden has fallen back to sixth place following a steep
decline in trade in 2013 and 2014. However Swedish
exports are now showing signs of stabilisation. The
gradual increase in wood furniture exports by Portugal and
Spain since 2012 and 2013, respectively, has continued
through 2014 and into 2015.
Lithuania

Lithuania has overtaken Sweden in the ranking of
Europe‟s largest wood furniture exporters. Lithuanian
exports more than doubled between 2010 and 2015.
According to ※enterpriselithuania.com§ major furniture
producers invested heavily in production expansion in the
country in the last few years. Lithuania is also a major
supplier of IKEA. Some of the loss in importance of
Sweden and the increase in importance of Lithuania may
be linked to IKEA shifting production capacities.
Romania is also growing in importance as a furniture
exporter, with average monthly exports rising around 35%
between January 2010 and March 2015. Romania benefits
from abundant quality raw material, particularly beech,
and a labour force which is relatively cheap by European
standards with a long-tradition of wood furniture
manufacturing.
Romania‟s exports are mainly destined for the EU, Russia,
and Middle East. There is also rising domestic furniture
demand in Romania, particularly in the hospitality sector.
Romania‟s manufacturers increasingly concentrate on
higher quality hardwood furniture as Chinese
manufacturers are taking a rising share of the Romanian
market for lower end furniture based on wood panels. |