|
Report from
North America
Recovery in wood product imports in May
US imports of most major wood products increased in
May. The most significant growth was in imports of
wooden furniture.
The increase is partly a recovery from low imports earlier
this year, when severe winter weather disrupted supply
chains, but May 2014 imports of furniture and several
other wood products were higher than at the same time last
year.
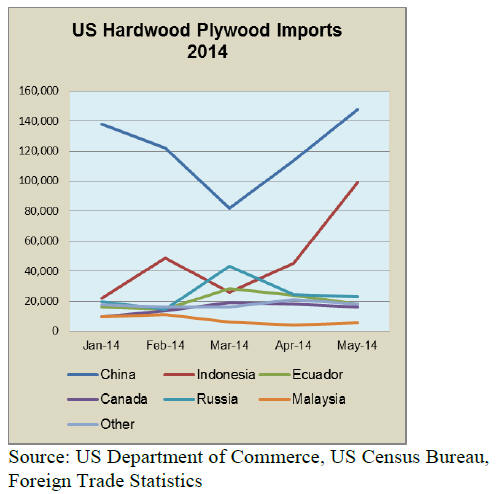
Hardwood plywood imports from Indonesia more than
doubled
Hardwood plywood imports in May at 327,887 cu.m were
around 30% higher than in April and year-to-date imports
are 6% higher than in 2013.

The growth in hardwood plywood imports was mainly in
hardwood plywood imports from Indonesia which shipped
more than doubled the amount from a month earlier to
almost 100,000 cu.m in May. Year-to-date imports from
Indonesia were 38% higher than in 2013.
Hardwood plywood imports from China also grew by 30%
to 147,958 cu.m. Year-to-date imports are still slightly
below 2013 (-3%). Hardwood plywood imports from
Russia, Ecuador and Canada all declined in May.
Brazil¡¯s moulding shipments up
The value of hardwood moulding imports was US$19.7
million in May, up 19% from the previous month. Year-todate
imports were 8% higher than in 2013.
Imports from all major suppliers increased, except Canada.
At US$6.9 million, China was again the largest source of
imports. Imports from China increased by 37% from
April, but year-to-date imports in 2014 are still below
2013 levels.
Brazil‟s moulding shipments were worth US$5.4 million
in May, up 25% from the previous month.
Hardwood flooring imports down, but Malaysia
shipped more
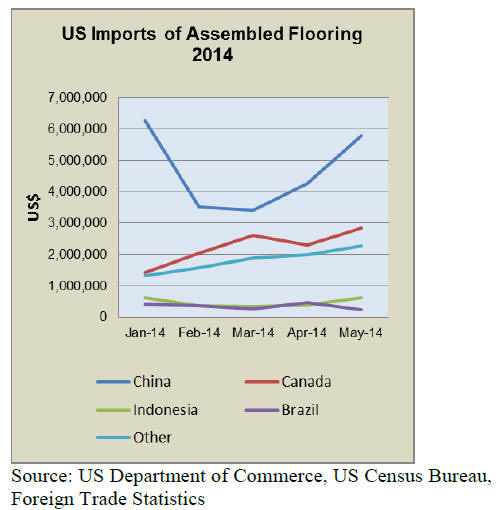
Imports of assembled flooring panels grew in May, while
hardwood flooring imports declined. Assembled flooring
imports were worth US$11.7 million in May, up 25% from
April. Hardwood flooring imports were US $2.9 million,
down 8%.

Assembled flooring shipments from China increased by
35% in May to US$5.8 million but solid hardwood
flooring imports from China were US$0.4 million, down
34%.
On a year-to-date basis assembled flooring panel imports
from China are below 2013 levels, while hardwood
flooring imports are 10% higher than last year.
Assembled flooring panel imports from Brazil fell by 50%
in May, while imports from Indonesia and Canada
increased. Year-to-date imports from Brazil are now 40%
below May 2013.
For hardwood flooring, Malaysia was the only major
supplier with higher shipments to the US in May and
imports from Malaysia increased by 27% to US $0.7
million. Brazil and Vietnam also shipped more hardwood
flooring to the US in May.
Growth in furniture imports from China, Vietnam and
Mexico
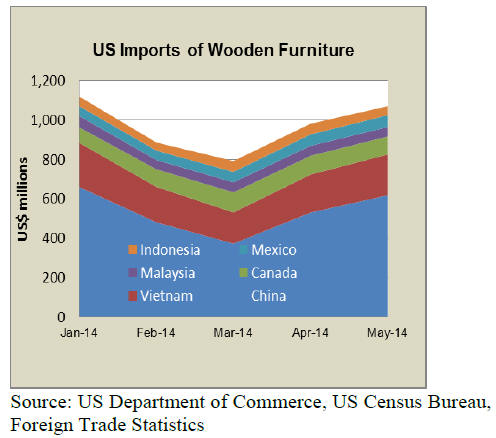
Wooden furniture imports continued to grow in May.
Total imports were worth US$1.25 billion, up 8% from
April and 11% higher year-to-date than in 2013.
China led the growth in shipments to the US market.
Imports from China were US$618.8 million in May, up
17%. China‟s share in total US imports of wooden
furniture year-to-date was 47.1% in May, slightly down
from 47.7% in May 2013.

Furniture imports from Vietnam were worth US$206.8
million, up 7%. Year-to-date imports from Vietnam were
50% higher than at the same time in 2013. Vietnam‟s
imports share to date in 2014 was 17.0%, up from 12.5%
in 2013.
Furniture imports from most other major suppliers
declined in May, with the exception of shipments from
Mexico.
Unemployment down, furniture manufacturing up
The unemployment rate in the US declined from 6.3% in
May to 6.1% in June, according to the Department of
Labor. Job gains were widespread, with the fastest
growing employment in professional and business
services.
In June the overall US economy expanded according to
survey data from the Institute for Supply Management.
The manufacturing sector continued to grow. The furniture
industry posted the highest growth rate of all industries.
Wood product manufacturers also reported production
growth in June.
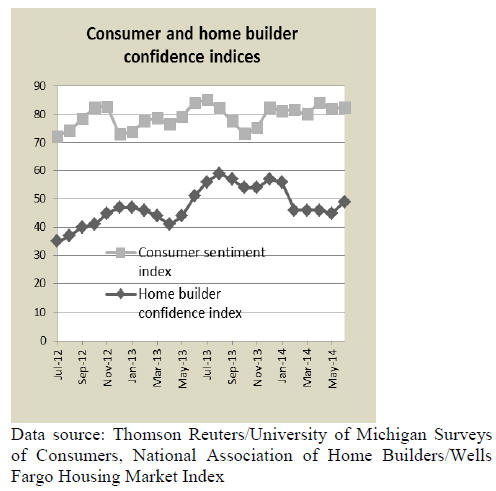
Neither consumers nor builders very confident
Consumer confidence in the US improved slightly in June,
despite poor economic growth in the first quarter of 2014.

Most consumers reported improvements in their financial
situation in June but were less optimistic about the future.
Only one quarter of household expected their finances to
improve in the year ahead.
Builders‟ confidence in the market for newly built singlefamily
homes increased significantly in June, but it
remains just below what is considered good business
conditions.
Consumers are still hesitant to enter the housing market.
Decline in housing starts
Construction of both single-family and multi-family
homes declined in May, according to US Census Bureau
data. Housing starts fell by 6.5% to just over 1 million
units at a seasonally adjusted annual rate. Growth in the
housing market remains slow and builders are careful not
to add too much inventory.
The National Association of Home Builders still forecasts
a 12% growth in housing starts for 2014.
Housing starts increased in the US South, but they fell in
Northeast, Midwest and West. May data on sales of
existing homes was positive where sales were up almost
5% in May, although they remain below May 2013 levels.
The US housing inventory increased to 2.28 million
existing homes available for sale. Nevertheless, the
National Association of Realtors warn that some US states
could face housing shortages and low affordability unless
more new homes are built.
Canadian housing market steady
Canadian housing starts were steady in May at just under
200,000 at a seasonally adjusted annual rate but still
higher than the 181,100 housing starts predicted by the
Canadian Housing and Mortgage Corporation. The
number of multi-family starts declined slightly in May
while single-family construction grew by 6%.
The Canadian Housing and Mortgage Corporation still
expect reduced housing starts in 2014 compared to last
year. The average five-year mortgage rate was at 4.79% in
May, the lowest rate since data collection started in the
1970s.
Few changes in non-residential construction
Spending on non-residential was largely unchanged in
May. Public spending declined for the construction of
offices (-3.7%) and health care facilities (-2.2%).
The American Institute of Architects reported higher
activity in commercial and industrial construction in May
but overall the institutional construction market is still
weak.
Americans spend more on home remodeling
The home remodeling market grew strongly in the fourth
quarter of 2013 and the first half of 2014. Spending on
home repair and renovation increased by over 10% on an
annual basis, according to estimates by the Joint Center for
Housing Studies of Harvard University.
In the first quarter of 2014, the harsh winter weather had a
negative effect on the remodeling market. Spending is
expected to increase in the third quarter but towards the
end of 2014 the growth in spending on remodeling will
probably decline because homes sales are still relatively
slow.
The Joint Center for Housing Studies forecasts remodeling
spending of US$158.9 billion for the third quarter and
US$153.1 billion for the fourth quarter. Fourth quarter
spending in 2013 was estimated at US$139.9 billion.
Changing wood product use in N. American housing
markets
In North America, around US $500 billion are spent every
year on residential construction and remodeling. Ninety
percent of single-family homes in Canada and the US are
built of wood.
In the US, approximately two thirds of all new homes are
single-family houses. In Canada it is only one third
because the population is concentrated in urban areas
where land is increasingly scarce and expensive. In 2011
the share of single-family homes in new construction was
close to 40% in Canada, compared to 32% in May 2014.
Only about 50% to 65% of the multi-family buildings in
the US and Canada are built in wood. Not only is less
structural wood used in multi-family homes, but demand
for finishing and interior wood products is also lower.
The average home size of apartments is much smaller now
and less flooring, mouldings, furniture and fewer interior
doors and cabinets are used than in single-family homes.
In the US most multi-family housing is rental housing,
except in the Northeast. Price and low maintenance of
products is often more important than appearance in rental
housing.
Many products used in multi-family housing are made
from non-wood materials such as plastic or metal.
In Canada most multi-family homes are occupied by their
owners and the use of wood finishing materials is higher
(for example, wood flooring and wooden kitchen
cabinets).
The share of multi-family homes in the US has been on the
rise since the housing market crisis. Demand for rental
apartments is high, according to the report „The State of
the Nation‟s Housing‟ by the Joint Center for Housing
Studies of Harvard University. Between 2011 and 2014
the share of multi-family in new construction increased
from 25% to 38%.
The Canadian Housing and Mortgage Corporation expect
the multi-family market to remain strong, especially in
Vancouver, Toronto and Montreal. Canada‟s high
immigration rate supports multi-family construction in the
urban centres.
Any further growth in multi-family housing will affect the
types and volumes of wood products sold for construction,
repair and remodeling of homes in both the US and
Canada. In the US, the trend will be towards durable and
low maintenance floors, mouldings and cabinets, often
non-wood products. In Canada, wood appearance products
will be in high demand to make apartments more attractive
to potential buyers.
US Supreme Court ruling on greenhouse gas emission
rules
The Supreme Court ruled in June that the US government
is permitted to regulate greenhouse gas emissions from
industry through its Clean Air Act. The Environmental
Protection Agency (EPA) requires power plants, oil
refineries and other large emission sources to obtain
permits and control emissions when they modify an
existing plant or build a new one.
But smaller facilities that the EPA wanted to regulate will
likely be exempt from the regulation. The smaller facilities
include many wood product manufacturers, pulp and paper
mills and chemical production plants.
For many smaller companies the regulation would have
meant a significant administrative and financial burden to
their business. The large commercial facilities account for
86% of greenhouse gas emissions from stationary sources
in the US (i.e. excluding transportation). The smaller
facilities now excluded from the new regulation account
for just 3% of emissions.
The EPA ruling did not distinguish emissions from fossil
fuels and biomass such as wood. Following the Supreme
Court decision the EPA will consider the appropriate
treatment of emissions from biomass.
|